2024 Admissions Cycle Data Release
Today New York City Public Schools is releasing a summary of the fall 2024 admissions processes.
Today New York City Public Schools is releasing a summary of the fall 2024 admissions processes.
This year, across the board, offers were released earlier than they have been in the past several years, giving families more time to plan. Key takeaways show that:
- More middle and high school applicants received an offer to their top choice school than in prior years;
- Specialized High School offers to Black and Hispanic students increased to highest levels since 2013; and
- Application rates for 3K and Kindergarten programs continued to increase.
High School Admissions
On March 7th, approximately 72,000 8th graders received a high school offer for fall 2024 admissions, with 51 percent of applicants receiving an offer to their first choice (up from 48 percent last year), and 77 percent receiving an offer to one of their top three choices (up from 74 percent last year). For the second year in a row, offers were in the hands of parents before the independent school deposit deadline.
| Category | 2024 | 2023 | 2022 | 2021 | 2020 |
|---|---|---|---|---|---|
| Number of HS applicants | 70,807 | 71,059 | 71,138 | 74,354 | 76,008 |
| Number of offers to application choices | 67,805 | 67,430 | 67,055 | 69,956 | 71,940 |
| % of applicants who received an offer to an application choice | 96% | 95% | 94% | 94% | 95% |
Screened High Schools
Similar to last year, the top-performing applicants from across each middle school and citywide were prioritized for admission to screened programs.
Students fall into a screened admissions groups based on the average of their final seventh-grade core course grades (ELA, Math, Science, Social Studies). This average must fall into the top percentage of students citywide or at a student’s school to fall within a certain admissions group. Students were admitted to screened programs in group order, starting with students in group one.
Overall, the percentages of screened offers continue to be more racially and economically representative of the city compared to fall 2020 and 2021.
| Category | Fall 2024 Percent of Offers to Screened Programs | Fall 2023 Percent of Offers to Screened Programs | Fall 2022 Percent of Offers to Screened Programs | Fall 2021 Percent of Offers to Screened Programs | Fall 2020 Percent of Offers to Screened Programs |
|---|---|---|---|---|---|
| Asian | 24% | 25% | 24% | 28% | 26% |
| Black | 19% | 19% | 20% | 18% | 19% |
| Hispanic | 32% | 31% | 32% | 28% | 26% |
| Other | 3% | 3% | 3% | 3% | 3% |
| White | 17% | 17% | 17% | 19% | 19% |
| FRL-eligible | 67% | 67% | 68% | 63% | 60% |
| Private | 5% | 5% | 4% | 5% | 6% |
| Total | 19,442 | 19,088 | 19,168 | 19,651 | 21,190 |
Specialized High Schools
This year, 4.5 percent of offers went to Black students (up from 3 percent last year) and 7.6 percent of offers went to Hispanic students (up from 6.7 percent last year).
~25,700 8th graders took the SHSAT this year, and ~4,100 received an offer to a testing Specialized High School based on their exam score. Our goal is that students in Specialized High Schools reflect the diversity of New York City. NYCPS Specialized High Schools Diversity Initiatives like Discovery aim to increase testing, offer, and acceptance rates for high-potential students in underrepresented communities.
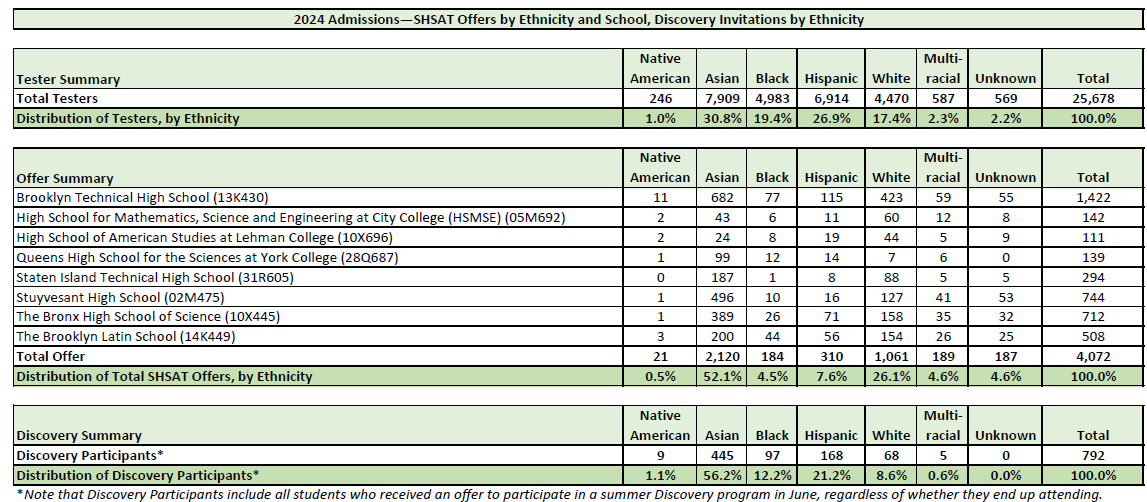
An additional ~1,400 were invited to apply for Discovery, which provides opportunities for certain disadvantaged students who scored within a certain range on the Specialized High Schools Admissions Test (SHSAT) during the 2023-2024 school year to attend a testing Specialized High School starting Fall 2024, and ~800 were approved to participate in the program.
Middle School Admissions
On April 3rd, approximately 60,000 6th graders received a middle school offer for fall 2024 admissions, down slightly from last year.
The data shows that 77 percent of applicants received an offer to their first choice, up from 74 percent last year and 93 percent received an offer to one of their top three choices, up from last year. Students received offers three weeks earlier than last year.
| Category | 2024 | 2023 | 2022 |
|---|---|---|---|
| Number of MS applicants | 56,206 | 58,019 | 57,958 |
| Number of offers to application choices | 54,239 | 55,820 | 55,584 |
| % of applicants who received an offer to an application choice | 97% | 96% | 96% |
Kindergarten Admissions
Kindergarten admissions continued to see an increase, with approximately 56,000 children receiving offers, including those for Gifted and Talented programs. This includes approximately 2,500 offers to Gifted & Talented programs.
Kindergarten Applications and Offers, by Admissions Year
| Total | 2024 | 2023 | 2022 | 2021 | 2020 | 2019 |
|---|---|---|---|---|---|---|
| Total Applicants | 52,610 | 51,900 | 50,736 | 56,724 | 65,427 | 68,129 |
| Total Offers | 56,392 | 54,997 | 54,439 | 55,608 | 63,209 | 66,312 |
Note that prior to 2023 students could have received a separate kindergarten and G&T offer. All above numbers represent distinct students. Note that additional offers are made to families with MySchools accounts who do not submit applications.
For families that submitted applications:
- 81 percent of applicants received an offer to their first program choice.
- 97 percent of applicants received an offer to any choice on their application.
Percent of Families Who Received an Offer, By Choice
| Category | 2024 | 2023 | 2022 | 2021 | 2020 | 2019 |
|---|---|---|---|---|---|---|
| Top Choice | 81% | 82% | 79% | 75% | 71% | 69% |
| Top 3 Choices | 94% | 95% | 91% | 87% | 85% | 83% |
| Any Choice from Application | 97% | 98% | 95% | 92% | 91% | 88% |
Pre-K Admissions
On May 14th, approximately 59,000 children received a pre-K offer for fall 2024 admissions, down 2 percent from last year. 84 percent of applicants received an offer to their first program choice, in line with last year.
Year-Over-Year Count of Pre-K Applications and Offers
| Total values | 2024 | 2023 | 2022 | 2021 | 2020 | 2019 | 2018 |
|---|---|---|---|---|---|---|---|
| Total Applicants | 52,423 | 53,577 | 50,187 | 51,605 | 59,018 | 64,435 | 66,756 |
| Total Offers | 59,360 | 60,787 | 58,762 | 57,511 | 61,789 | 65,522 | 66,756 |
96 percent of applicants are receiving an offer to any choice on their application, the same as last year.
Note that additional offers are made to families with MySchools accounts who do not submit applications.
Percent of Families Who Received an Offer, By Choice
| Category | 2024 | 2023 | 2022 | 2021 | 2020 | 2019 | 2018 |
|---|---|---|---|---|---|---|---|
| Top Choice | 84% | 84% | 83% | 77% | 77% | 75% | 75% |
| Top 3 Choices | 94% | 94% | 94% | 91% | 90% | 88% | 88% |
| Any Choice From Application | 96% | 96% | 96% | 93% | 93% | 92% | 92% |
The remaining 4 percent of students did not receive an offer to an application choice but are on the waitlist for all programs on their application.
3K Admissions
On May 16th, approximately 42,000 children received a 3K offer for fall 2024 admissions, up 1 percent from last year and over 300 percent from 5-years ago. Demand for 3K seats continues to rise.
Year-Over-Year Count of 3K Applications and Offers
| Category | 2024 | 2023 | 2022 | 2021 | 2020 | 2019 |
|---|---|---|---|---|---|---|
| Total Applicants | 43,142 | 41,631 | 39,730 | 33,208 | 21,256 | 14,253 |
| Total Offers | 42,119 | 41,654 | 38,586 | 33,131 | 17,455 | 9,549 |
Note: Some offers counted above are to toddlers enrolled in childcare seats that did not submit applications. This is to ensure continuity of services. Additional offers are also made to children in low-demand neighborhoods that started applications but never submitted to ensure providers have the best chance of filling seats.
Among families that submitted applications:
- 64 percent of applicants received an offer to their first program choice.
- 84 percent of applicants received an offer to any choice on their application.
Percent of Families Who Received an Offer, By Choice
| Category | 2024 | 2023 | 2022 | 2021 | 2020 | 2019 |
|---|---|---|---|---|---|---|
| Top Choice | 64% | 68% | 63% | 61% | 46% | 39% |
| Top 3 Choices | 78% | 82% | 78% | 76% | 59% | 50% |
| Any Choice From Application | 84% | 86% | 84% | 81% | 64% | 55% |
| Offer | 94% | 96% | 92% | 92% | 82% | 67% |
The 6 percent of children (~2,400) that did not receive a placement on offer day continue to receive offers directly from programs on a rolling basis. As of May 18th, approximately 675 of these children have received at least 1 waitlist offer.